
Pooling Tool
Turn outages into opportunities
Key Features:
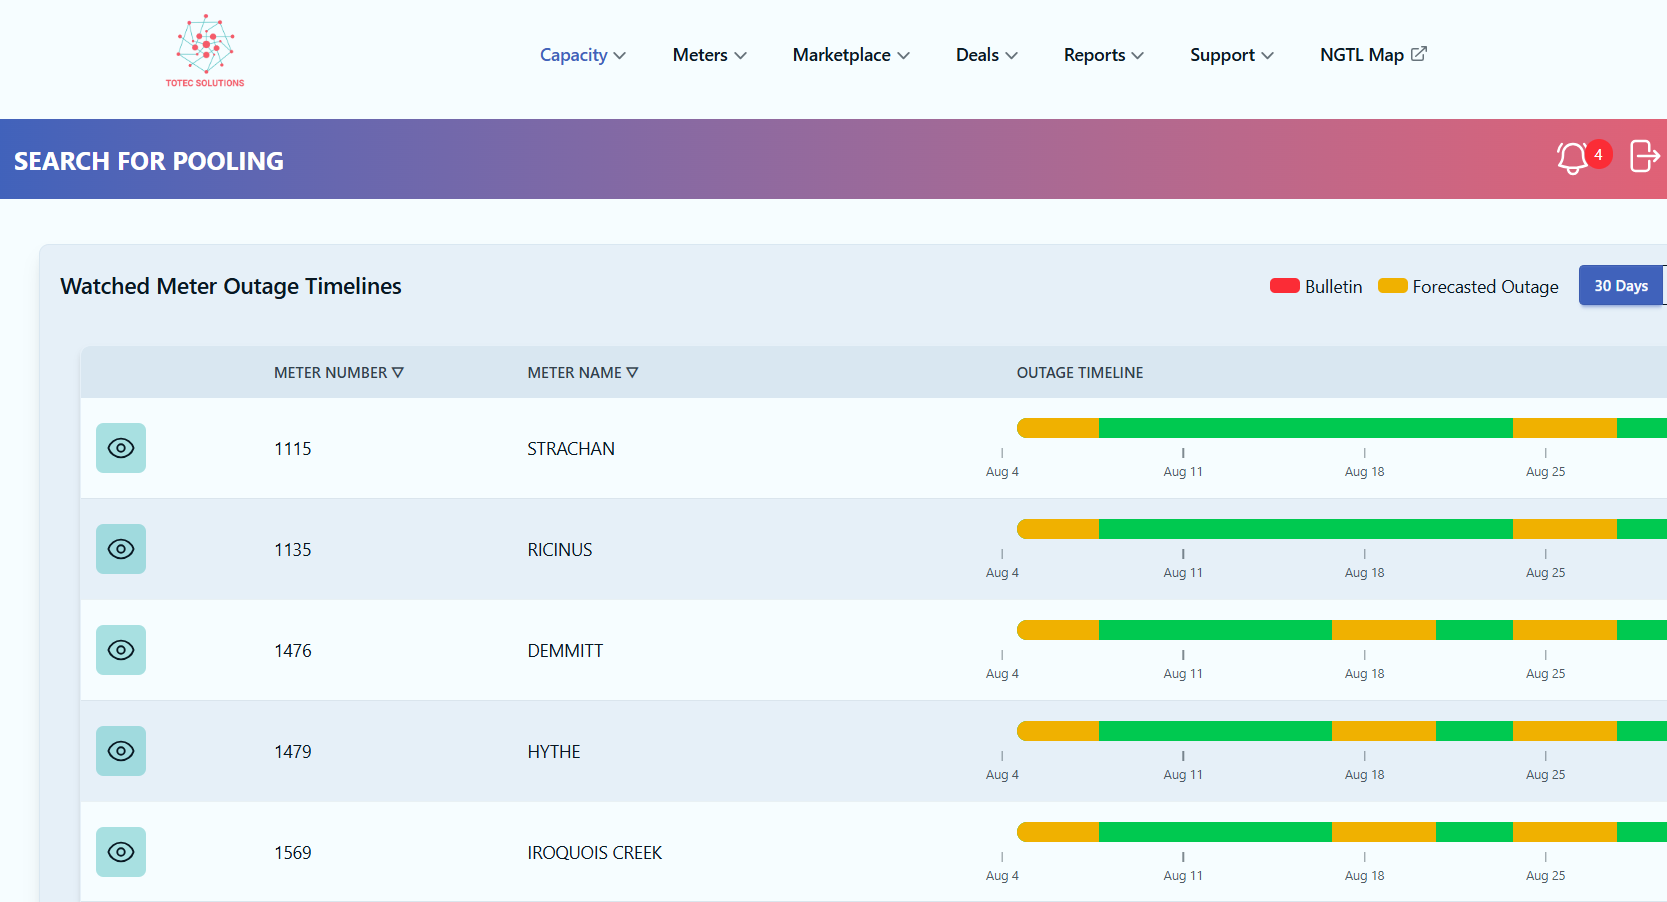
Discover capacity inside specific outages Instantly see available firm transportation that can be pooled or assigned during a particular outage event.
Monitor your Watched Meters Quickly review capacity opportunities tied to the meters you care about most, filtered specifically for outage periods.
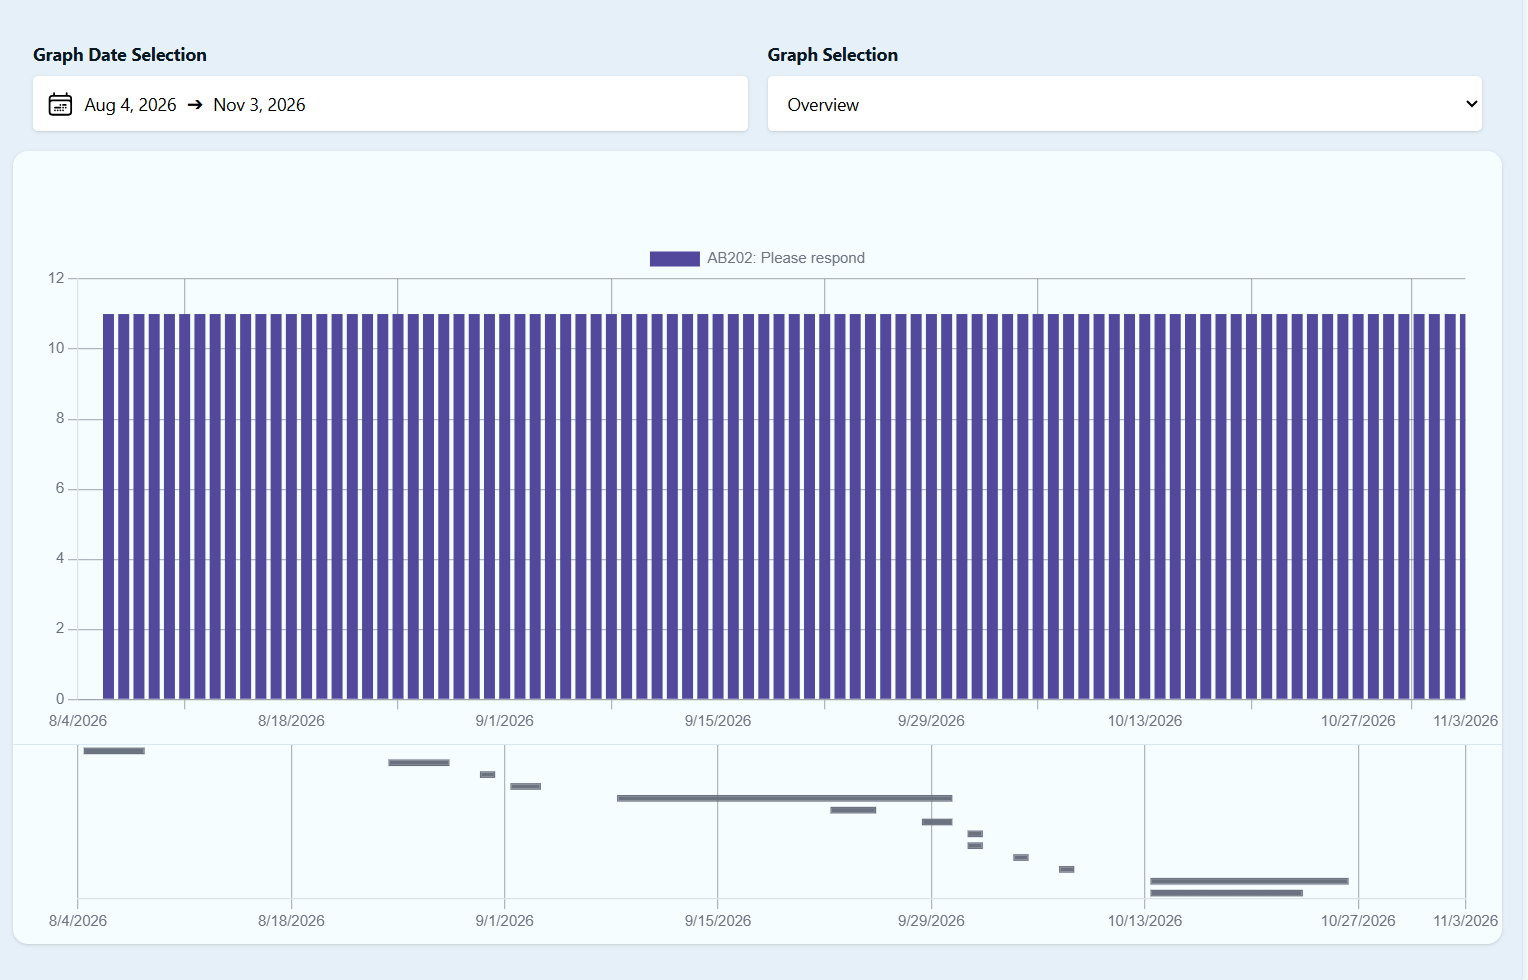
Look ahead across multiple timeframes Evaluate opportunities for next month, the next 3 months, or up to a full year — so you can plan ahead.
Compare and select the best option View available firm transportation for your meter(s) and choose the combination that best fits your operational and commercial needs.
Negotiate with multiple sellers, effortlessly Reach several counterparties at once, compare responses in one place, and lock in the strongest deal.
Why It Matters
Outages create both risk and opportunity. The Pooling Tool gives you visibility that traditional methods simply don’t offer — helping you protect your supply, reduce costs, and move firm transport where it creates the most value.