
Alberta Natural Gas Pipeline Digital Map
The Digital Map that started Hummingbird is now free for everyone. Real-time visualization of meters, constraints, outages, wild fires, transfer opportunities, and dynamic pipeline relationships.
“The Digital Map was the original vision that drove the entire Hummingbird platform. Three years later, we’re thrilled to make it freely available to the entire Natural Gas Industry.” — Manolo Martinez, Co-Founder & CEO, TOTEC Solutions
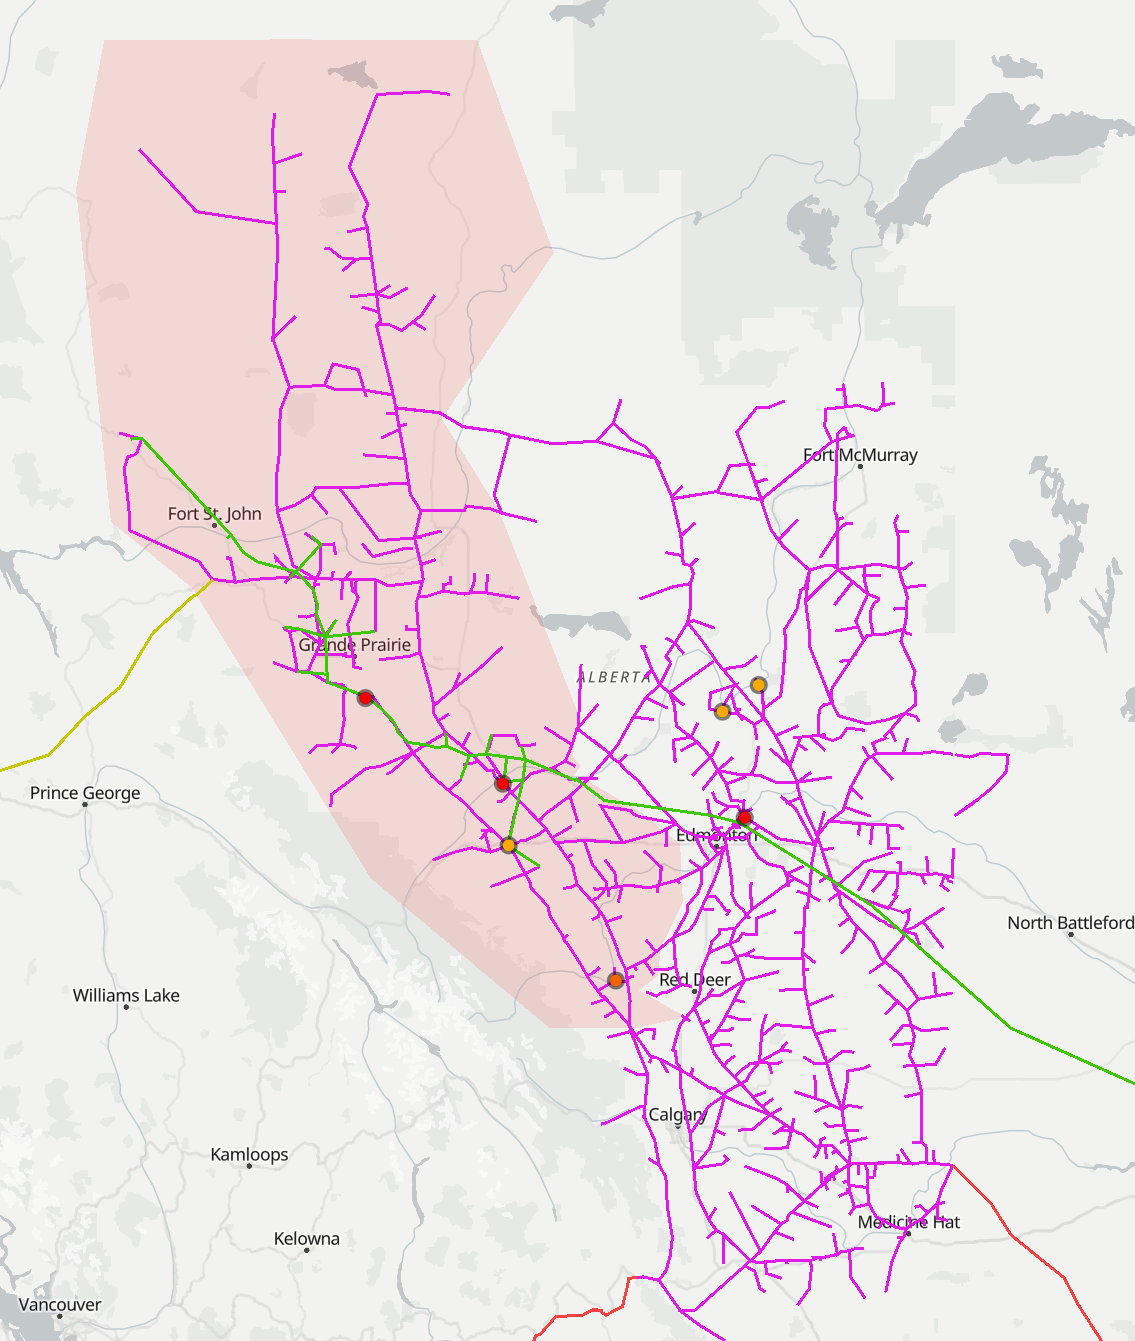
Custom Visualization - Visualize outages and constraint events impacting your meters and flows across the pipeline systems.
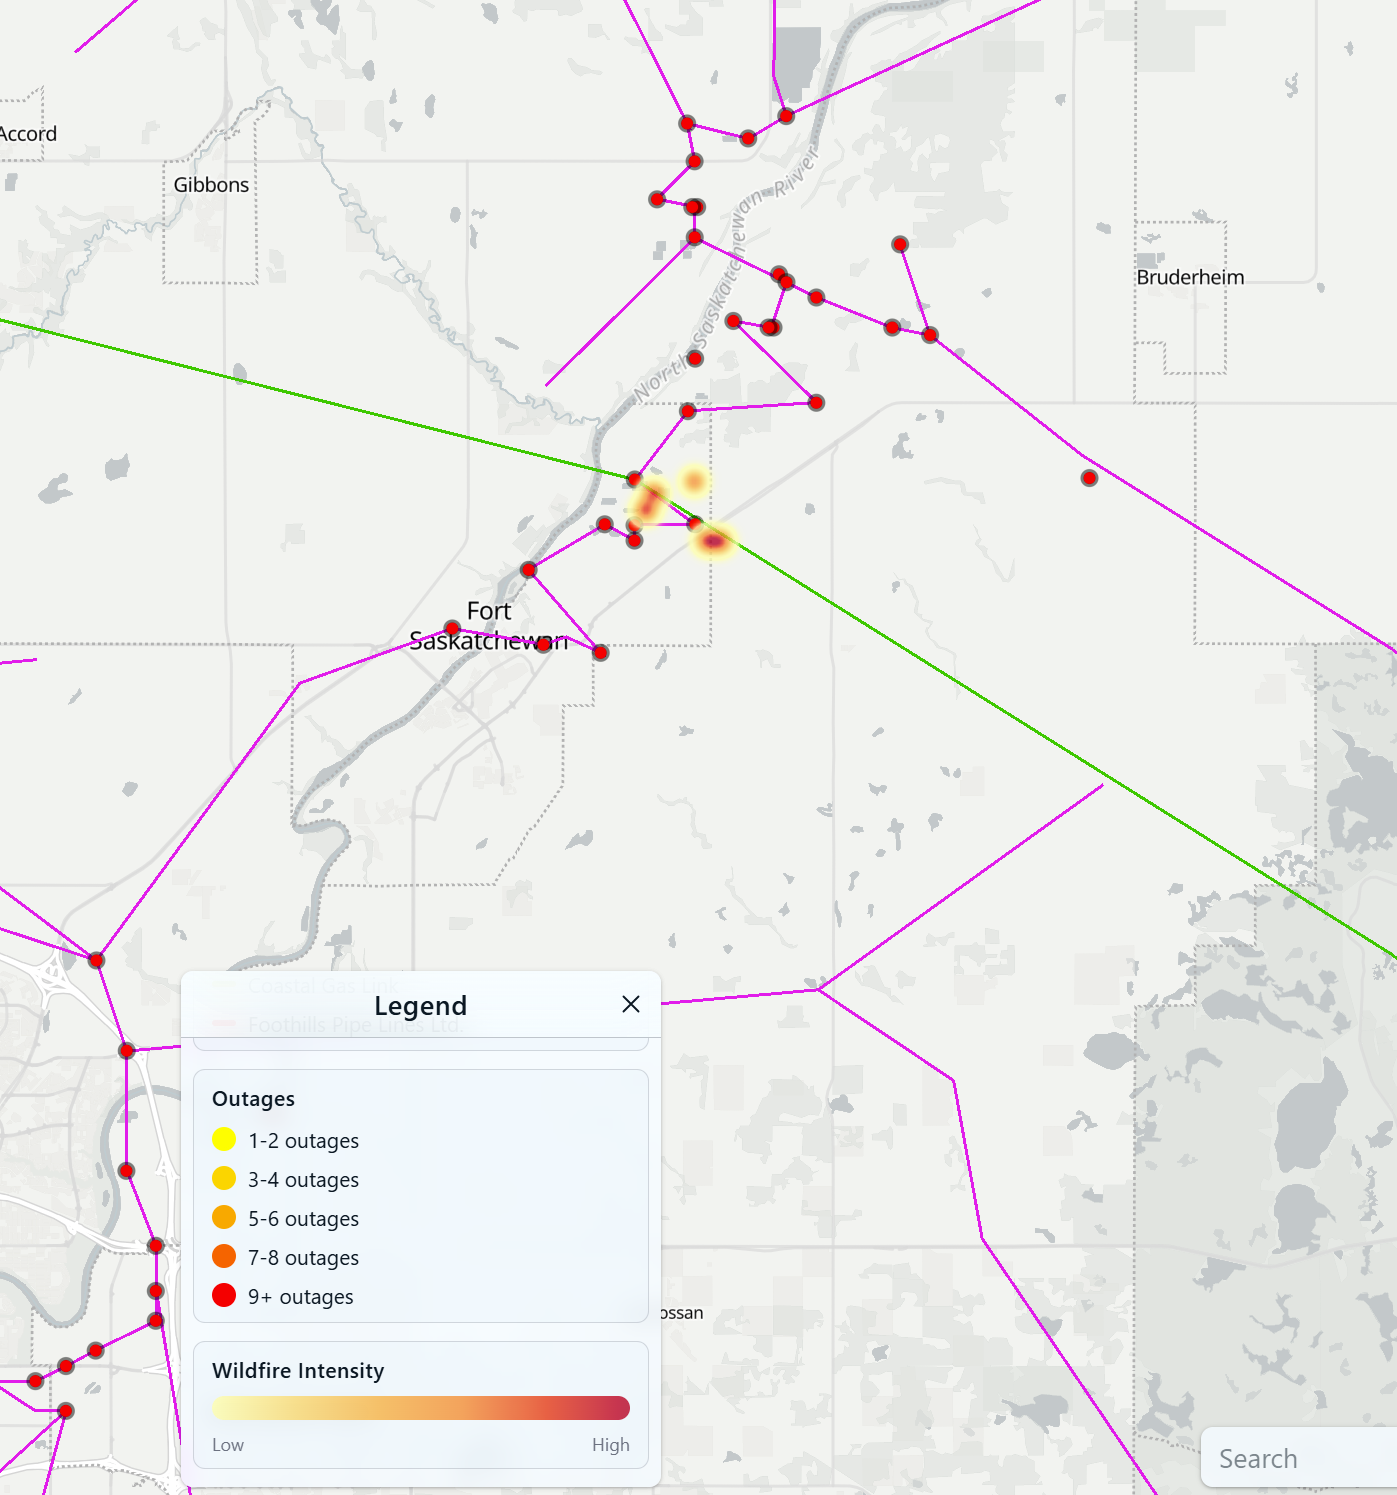
Wild Fires - Track and monitor wild fires near your meters and across the different pipeline systems in Alberta.
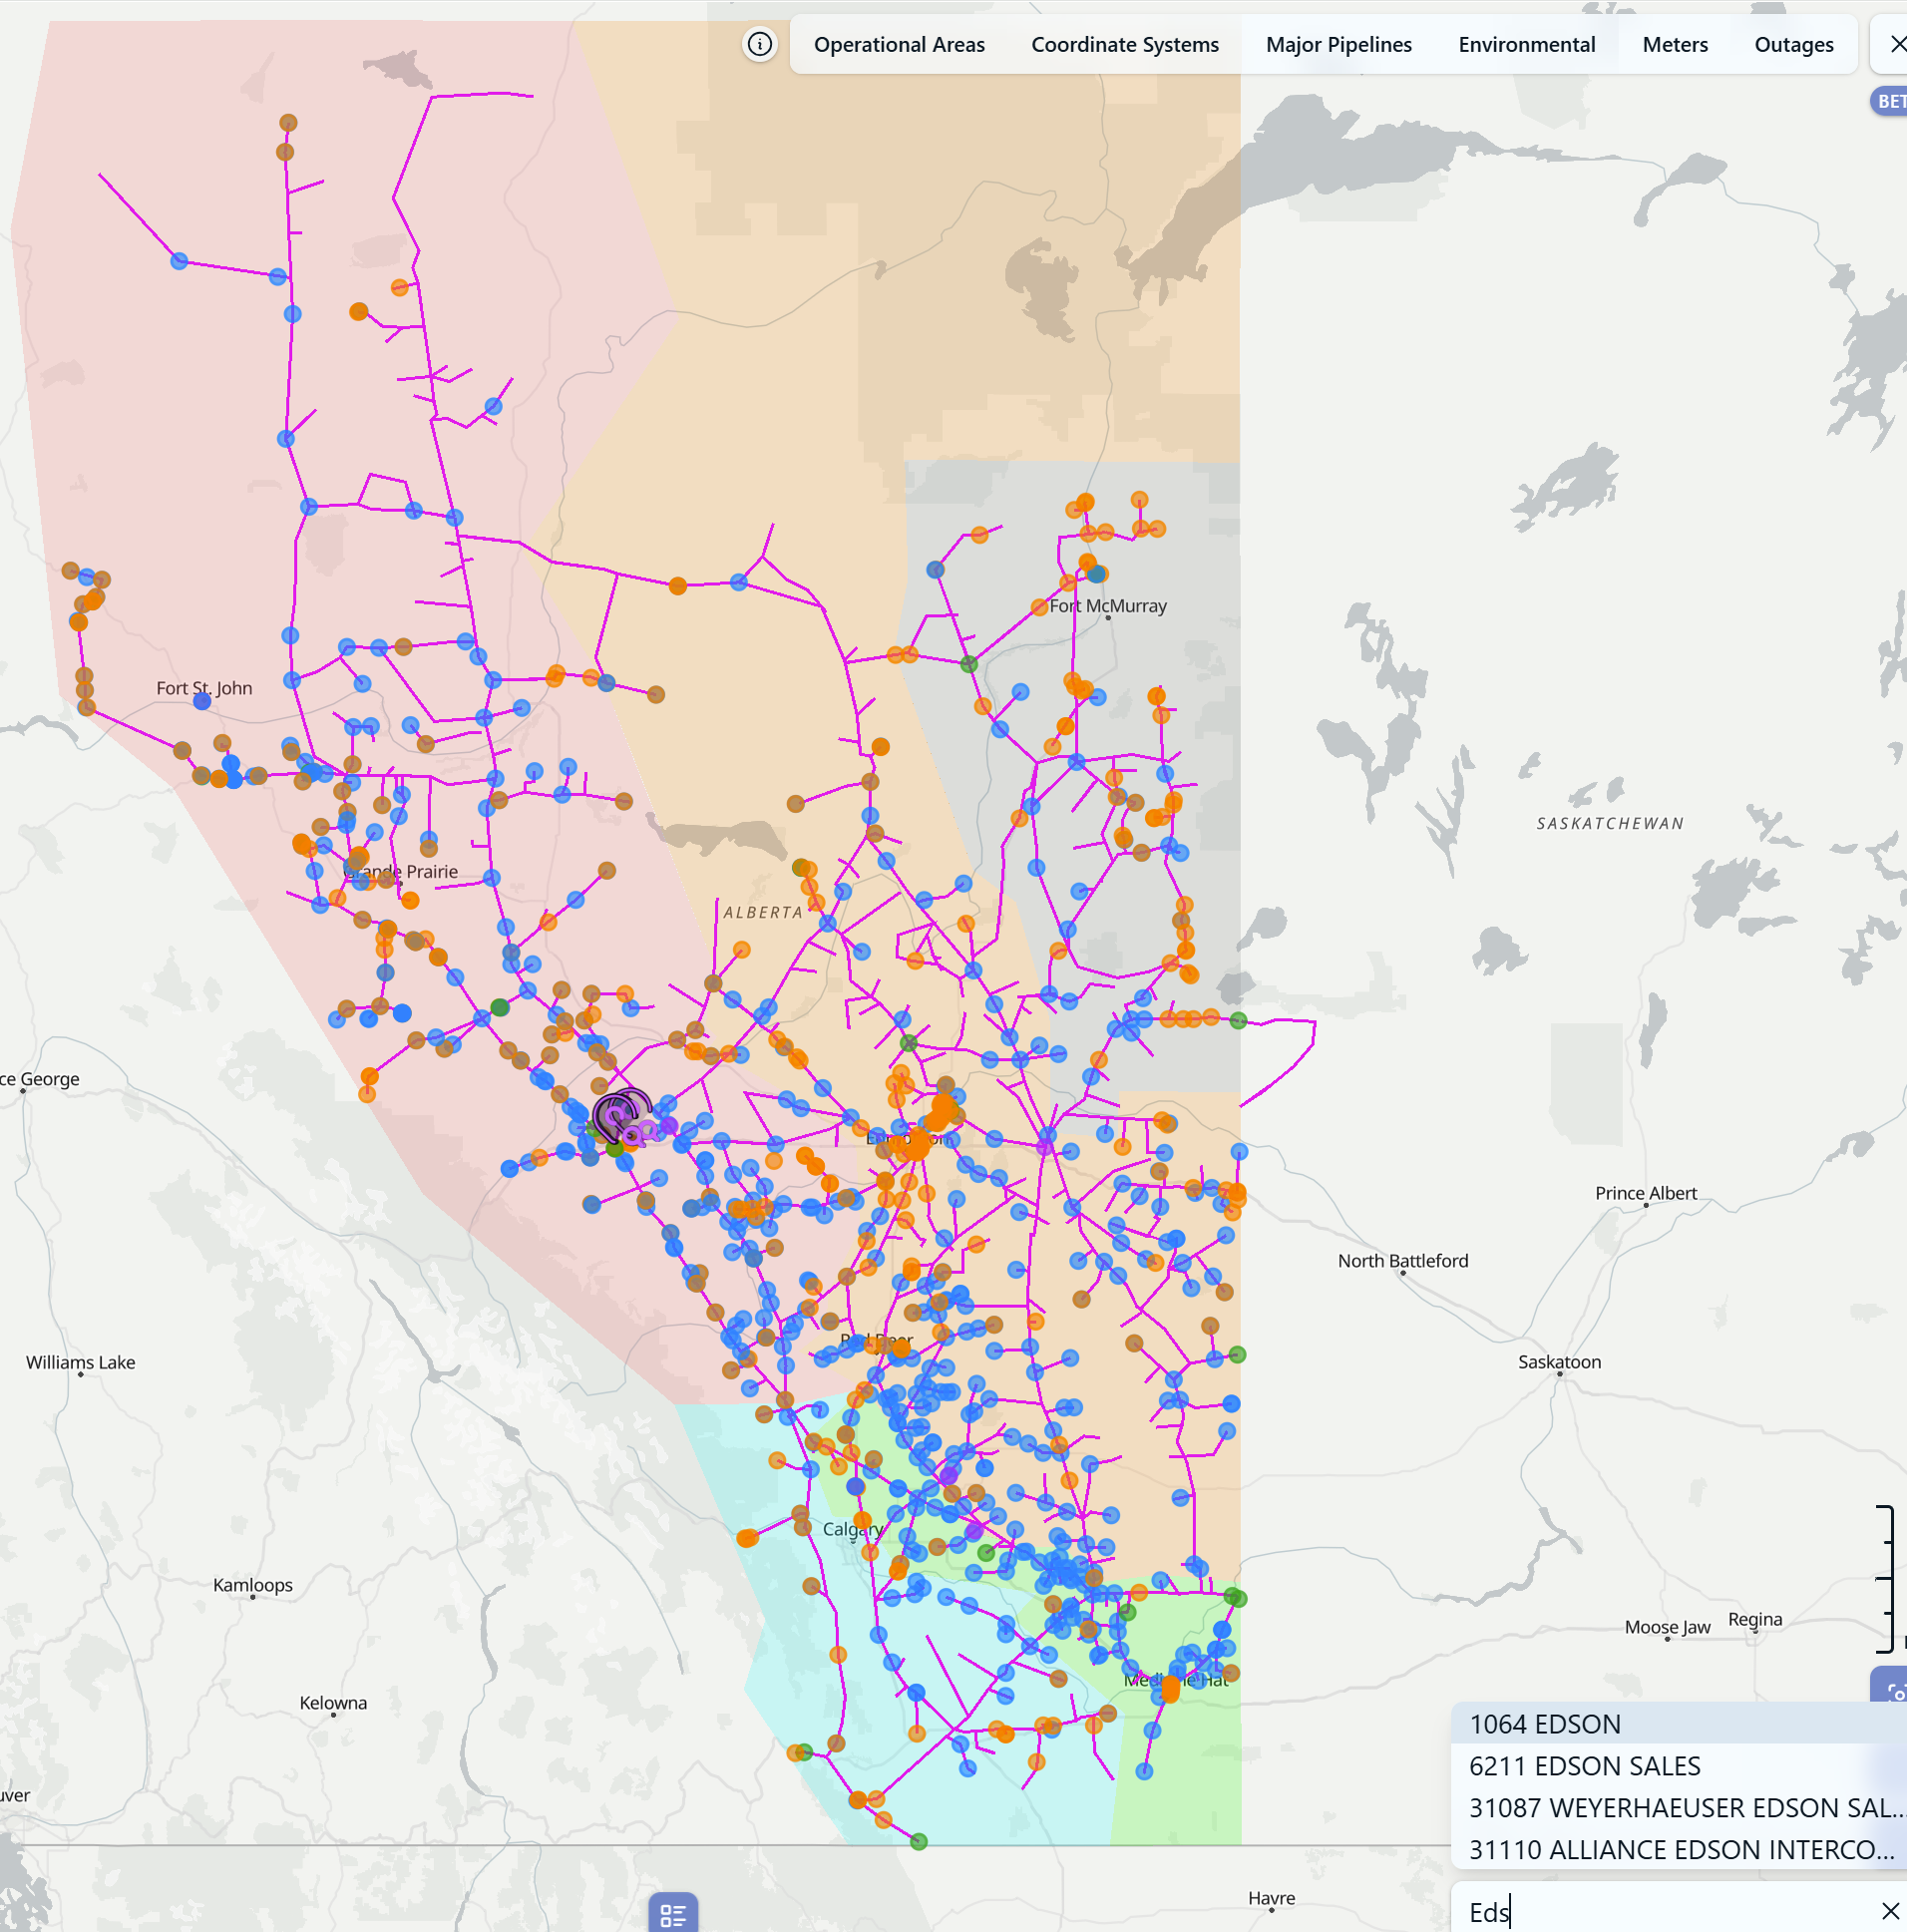
Easy to Use - Quickly search for any meter by number, name, or keyword, select operational areas, visualize intersecting pipelines, and easily zoom in/out for the level of detail you need.
Why It Matters
Gain instant clarity with our dynamic digital map, real-time meter relationships, live constraints, outage impacts, custom meter overlays, and wildfire intelligence — all designed to help you spot opportunities, mitigate risks, and make smarter decisions faster.
Whether you’re optimizing firm transport contracts, managing supply portfolios, or planning around seasonal and operational challenges, this is the moment to upgrade to professional-grade visibility and start capturing real savings and operational efficiencies.