
Outage Dashboard

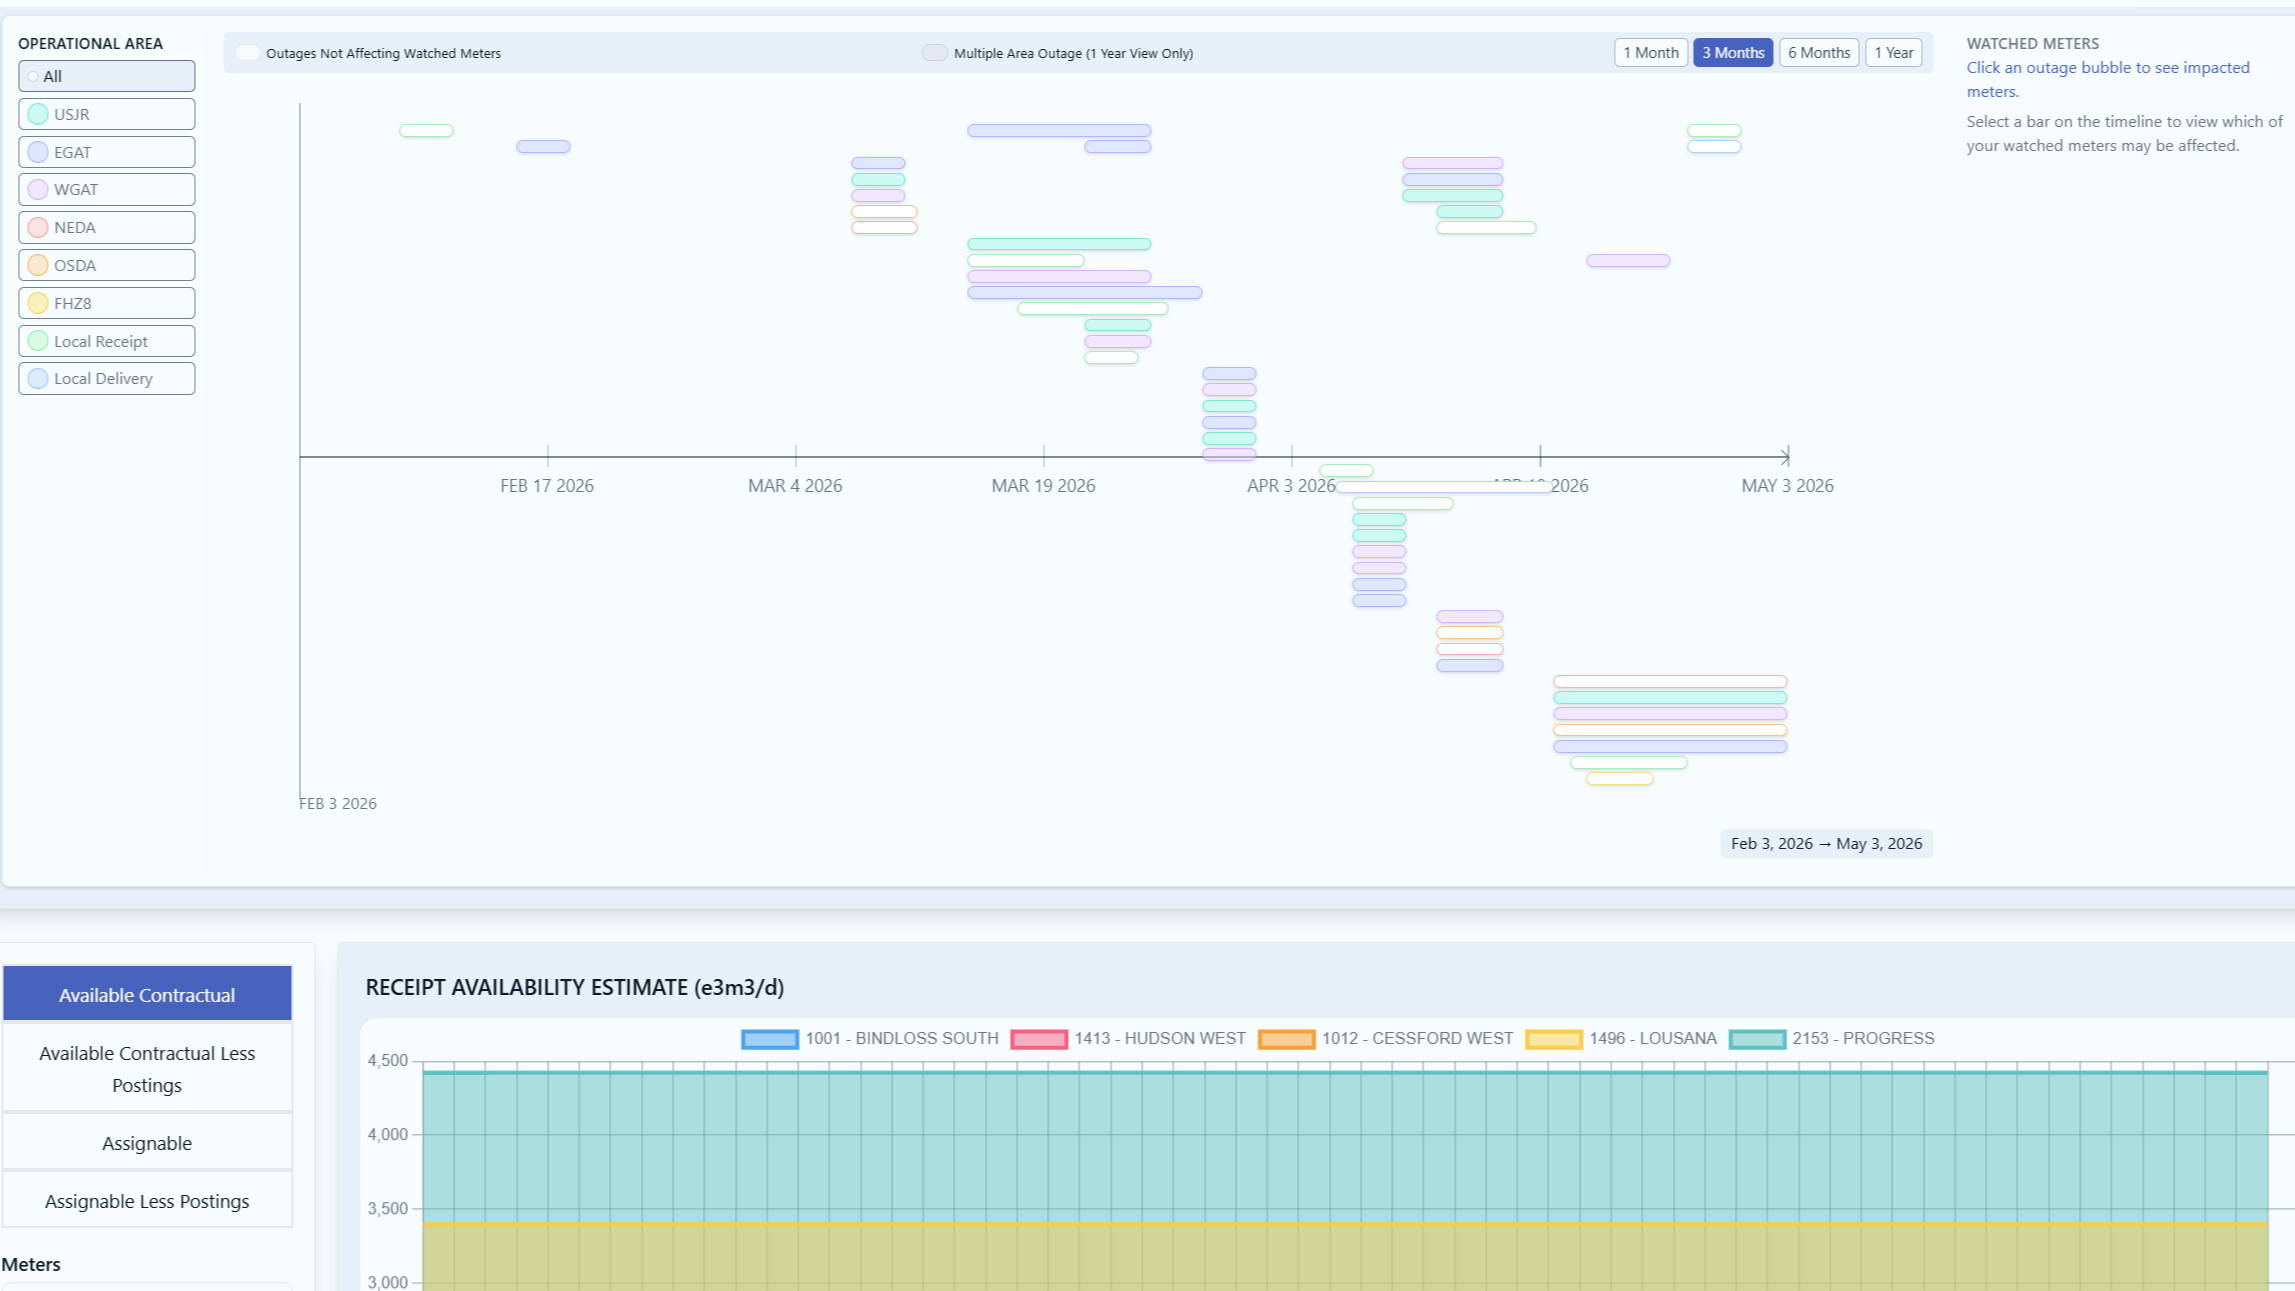
Comprehensive Impact Assessment Made Simple
Our outage dashboard delivers well-distilled, actionable insights about NGTL pipeline outages and their potential impacts. With a focus on clear and concise information, it enables you to quickly understand the direct effects on your meters.
This empowers you to assess risks effectively and address issues early, ensuring smooth operations and minimizing disruptions. Stay informed and proactive with a tool designed to simplify impact assessment and support your decision-making process.
Data available as reported by TC Energy’s Outage List.Elevate Your Outage Awareness with Our Intuitive Dashboard
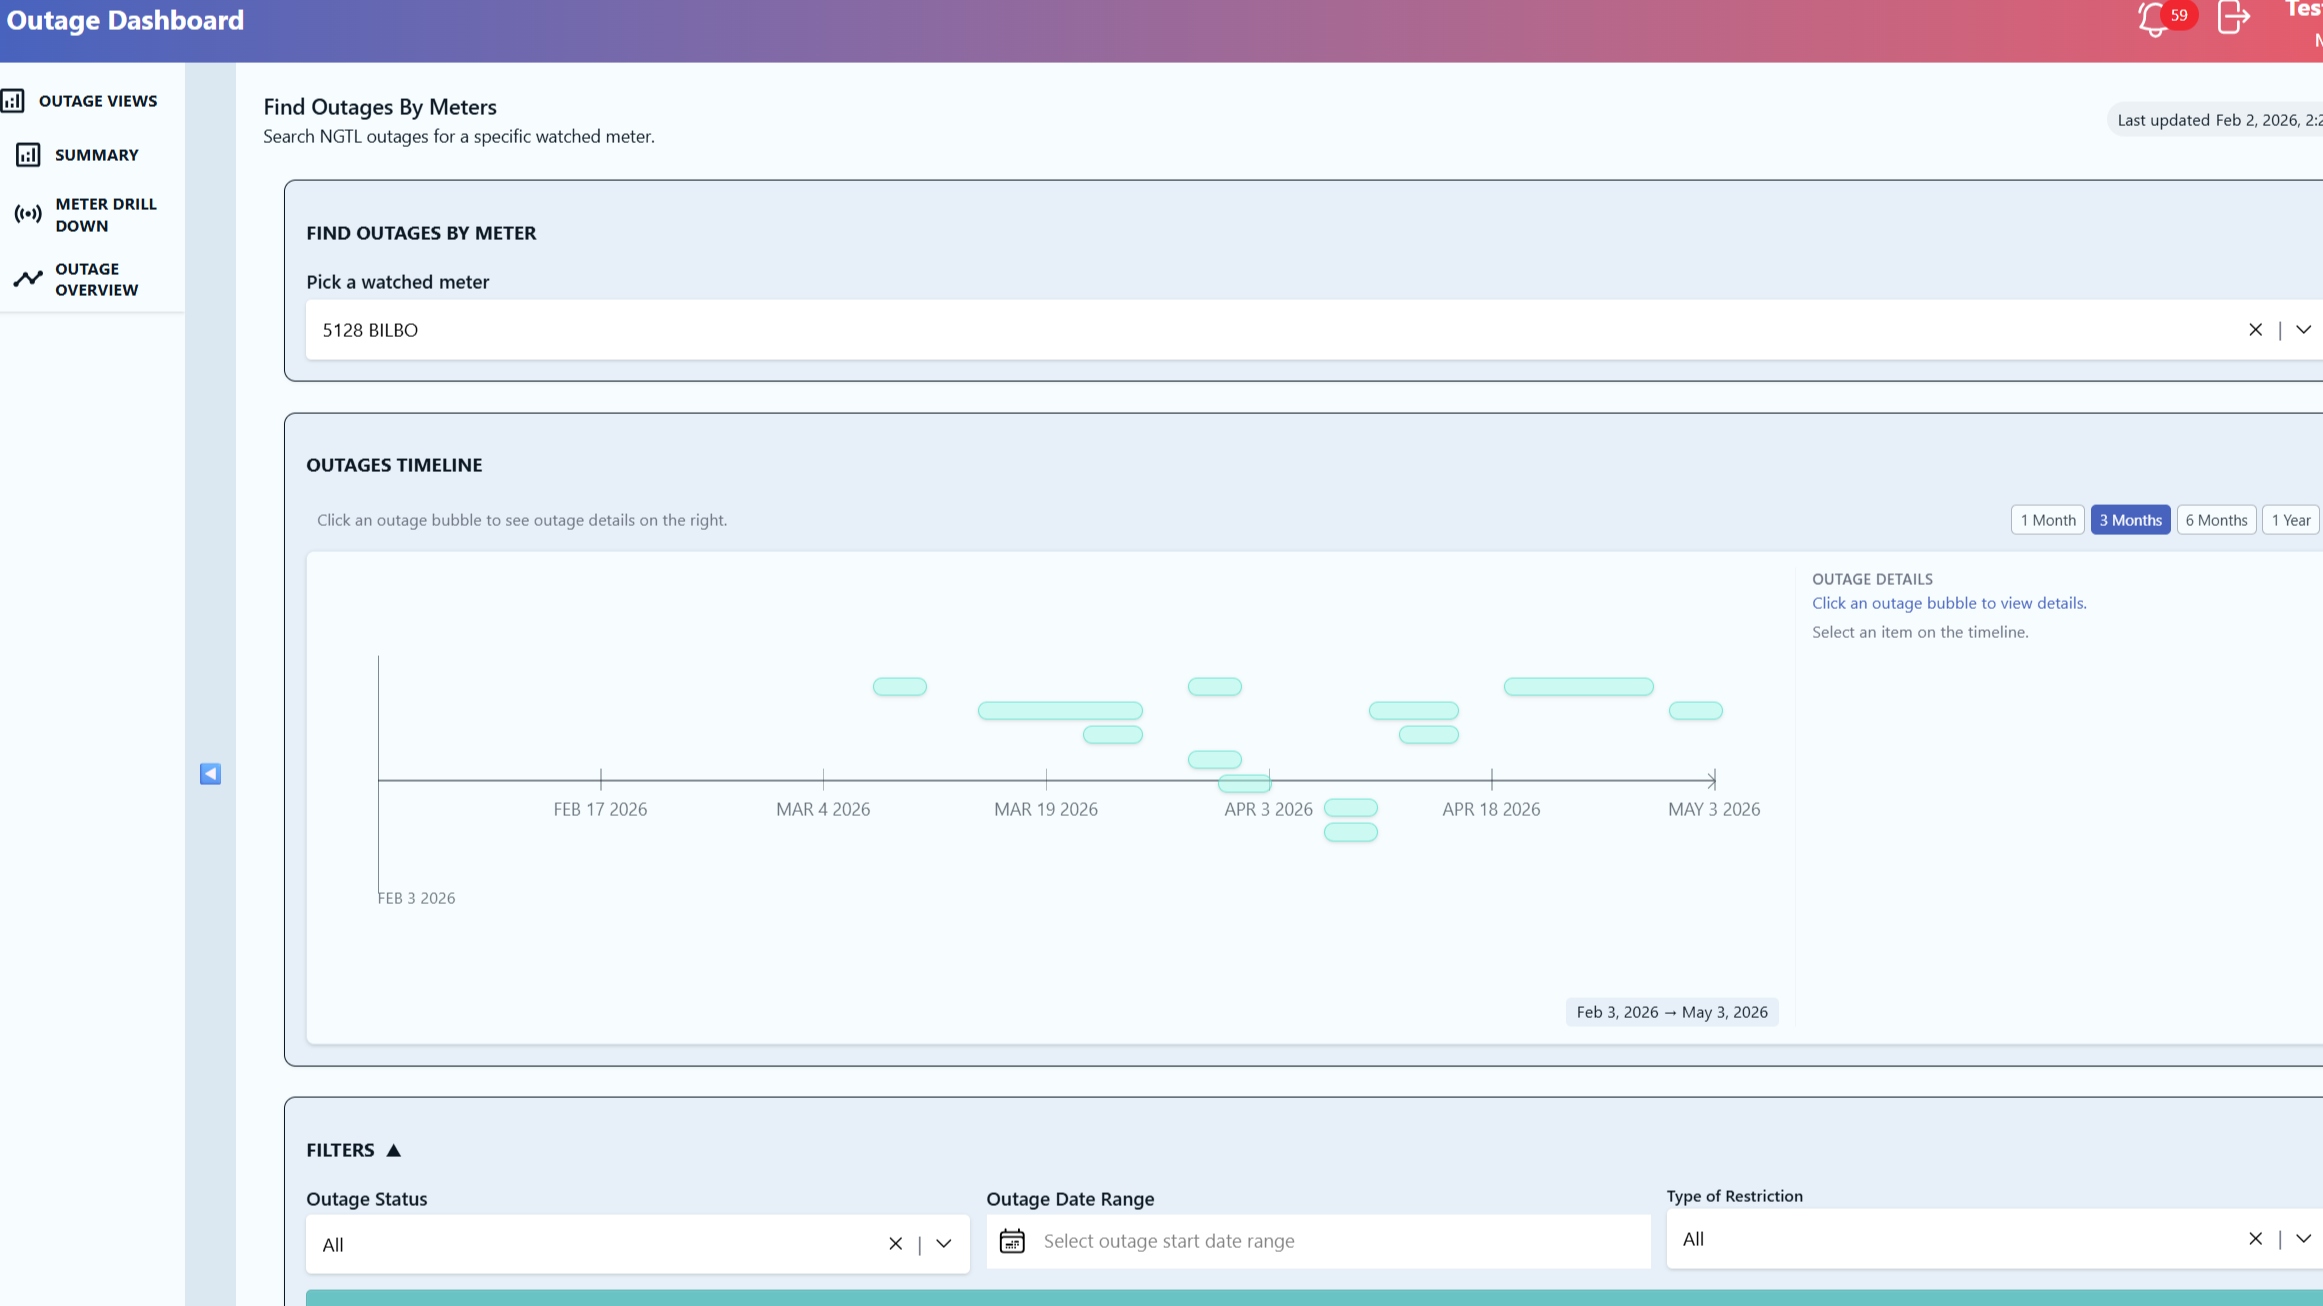
Maximize your operational efficiency and stay ahead of disruptions with our outage dashboard. Designed for clarity and ease of use, our platform offers comprehensive outage visibility by presenting all NGTL outages in a clear, intuitive format.
This allows you to quickly grasp the full scope of any event and its potential impact on your meters. By keeping you well-informed with real-time updates, our dashboard ensures that you have all the necessary information at your fingertips to make knowledgeable decisions.
Data available as reported by TC Energy’s Outage List.Precision Analysis at Your Fingertips
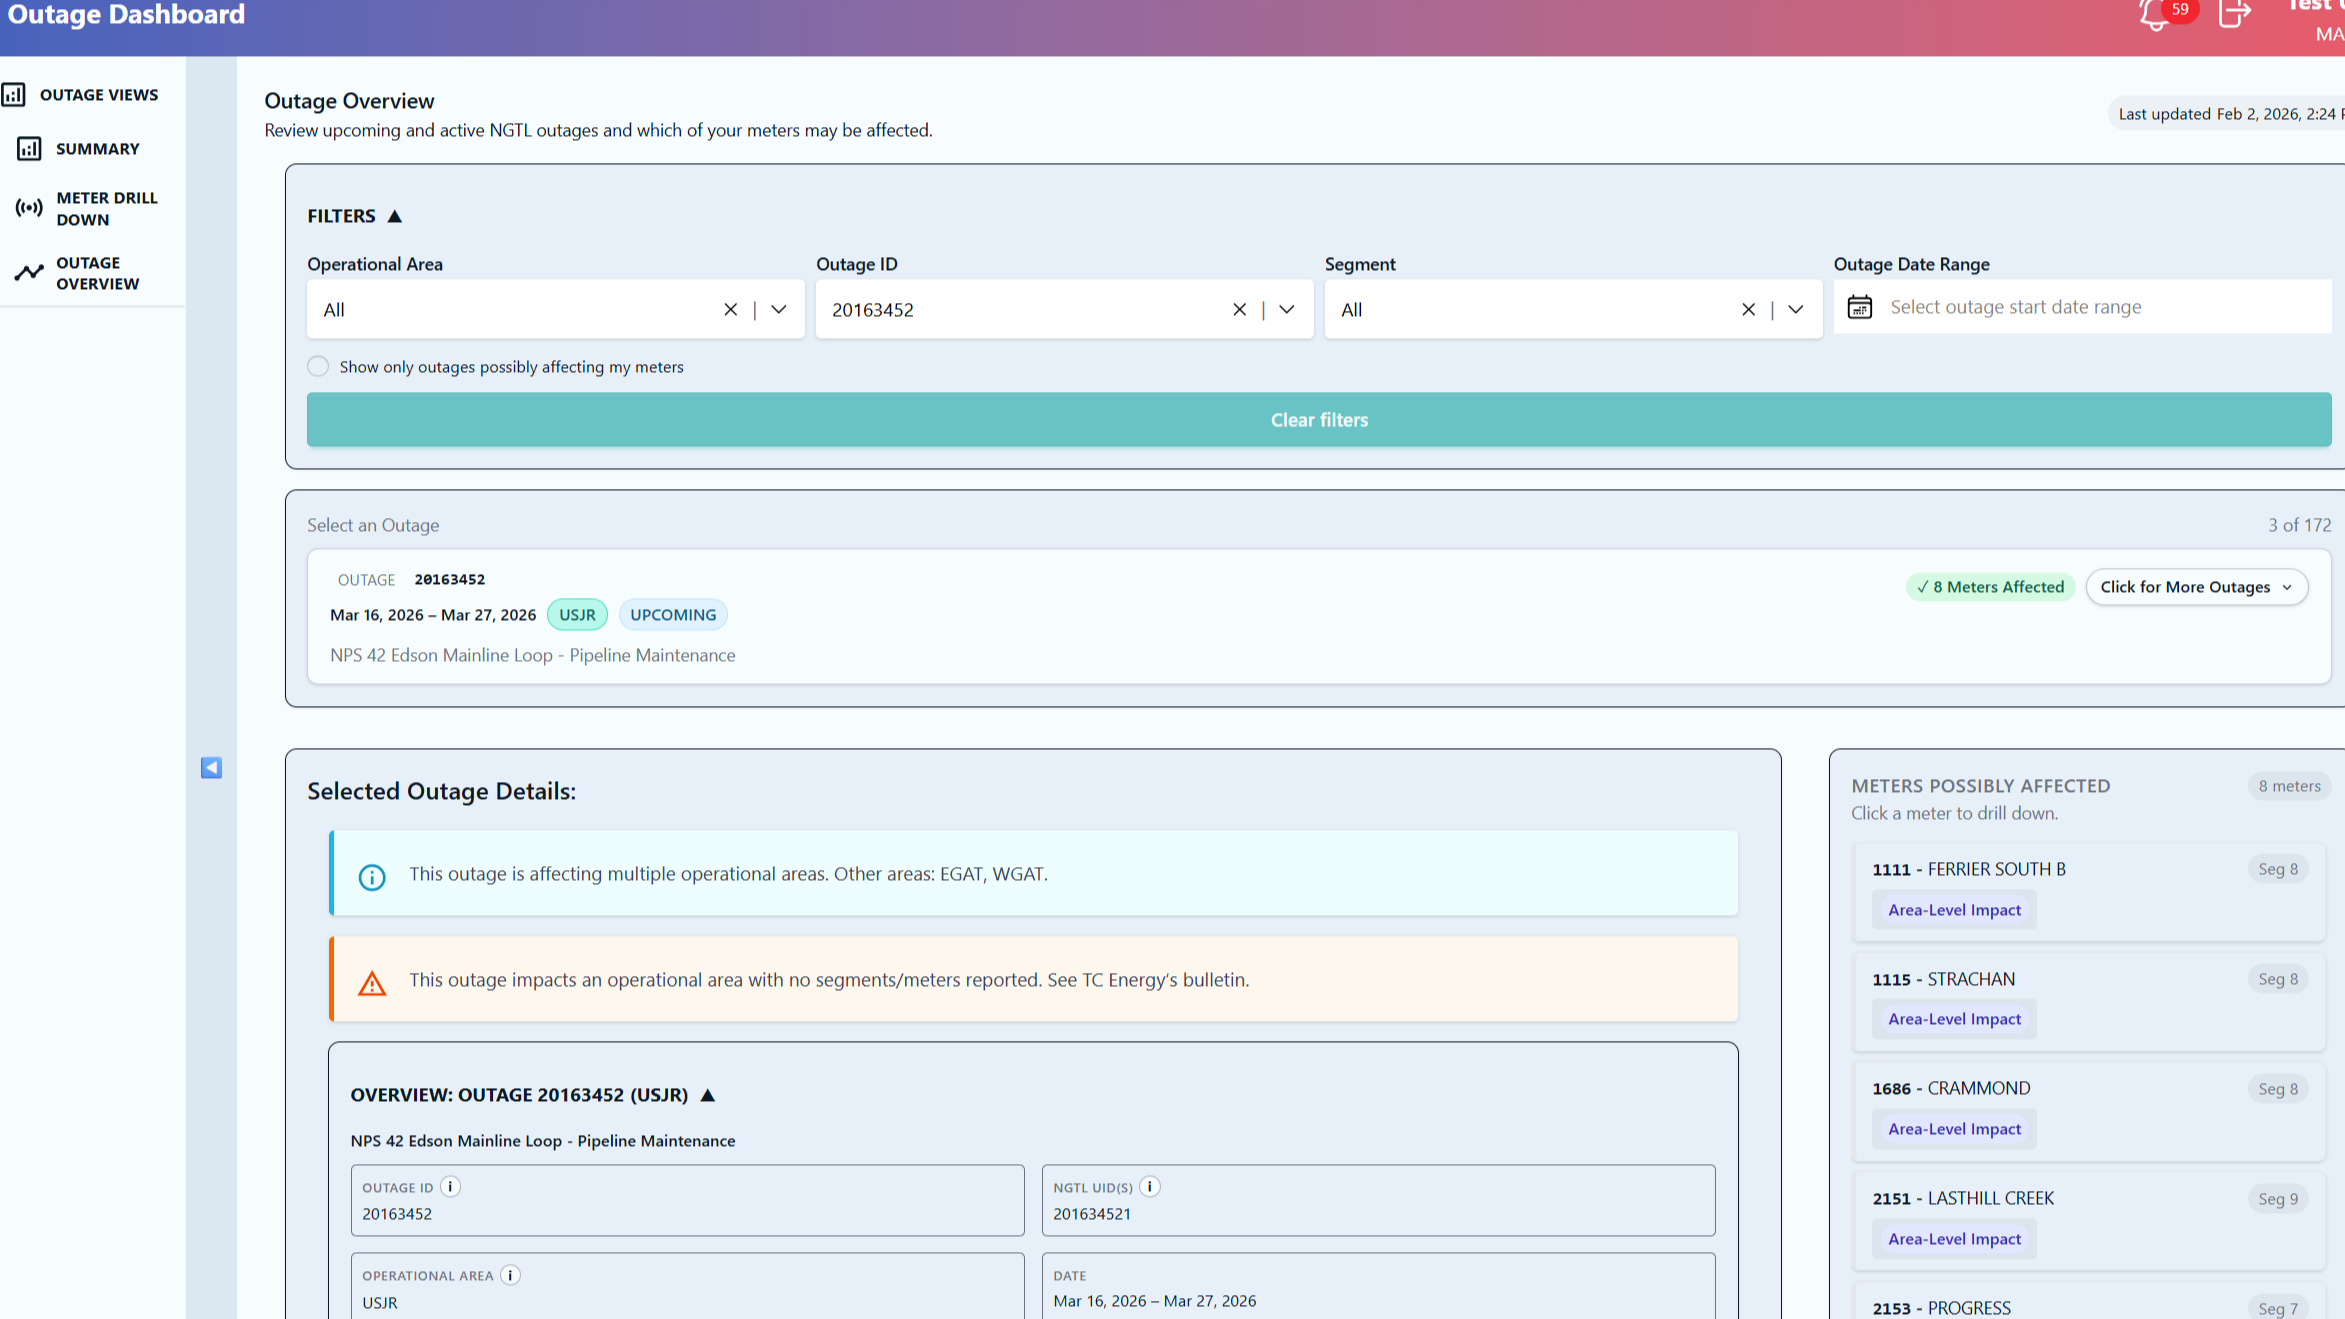
Our outage dashboard is thoughtfully designed to provide a seamless analytical experience, enabling you to drill down into specific meter-level details with ease.
This tailored approach allows for an in-depth examination of both current and anticipated NGTL outages, presenting you with a clear understanding of how each event may affect your operations.
Experience a streamlined process of assessing the implications for your meters, empowering you to plan effectively for the present and future with our user-friendly platform.